
Categories
Home Selling, Selling a HomePublished October 1, 2026
Where Katy, TX Home Sellers Are Feeling the Most Pressure Right Now

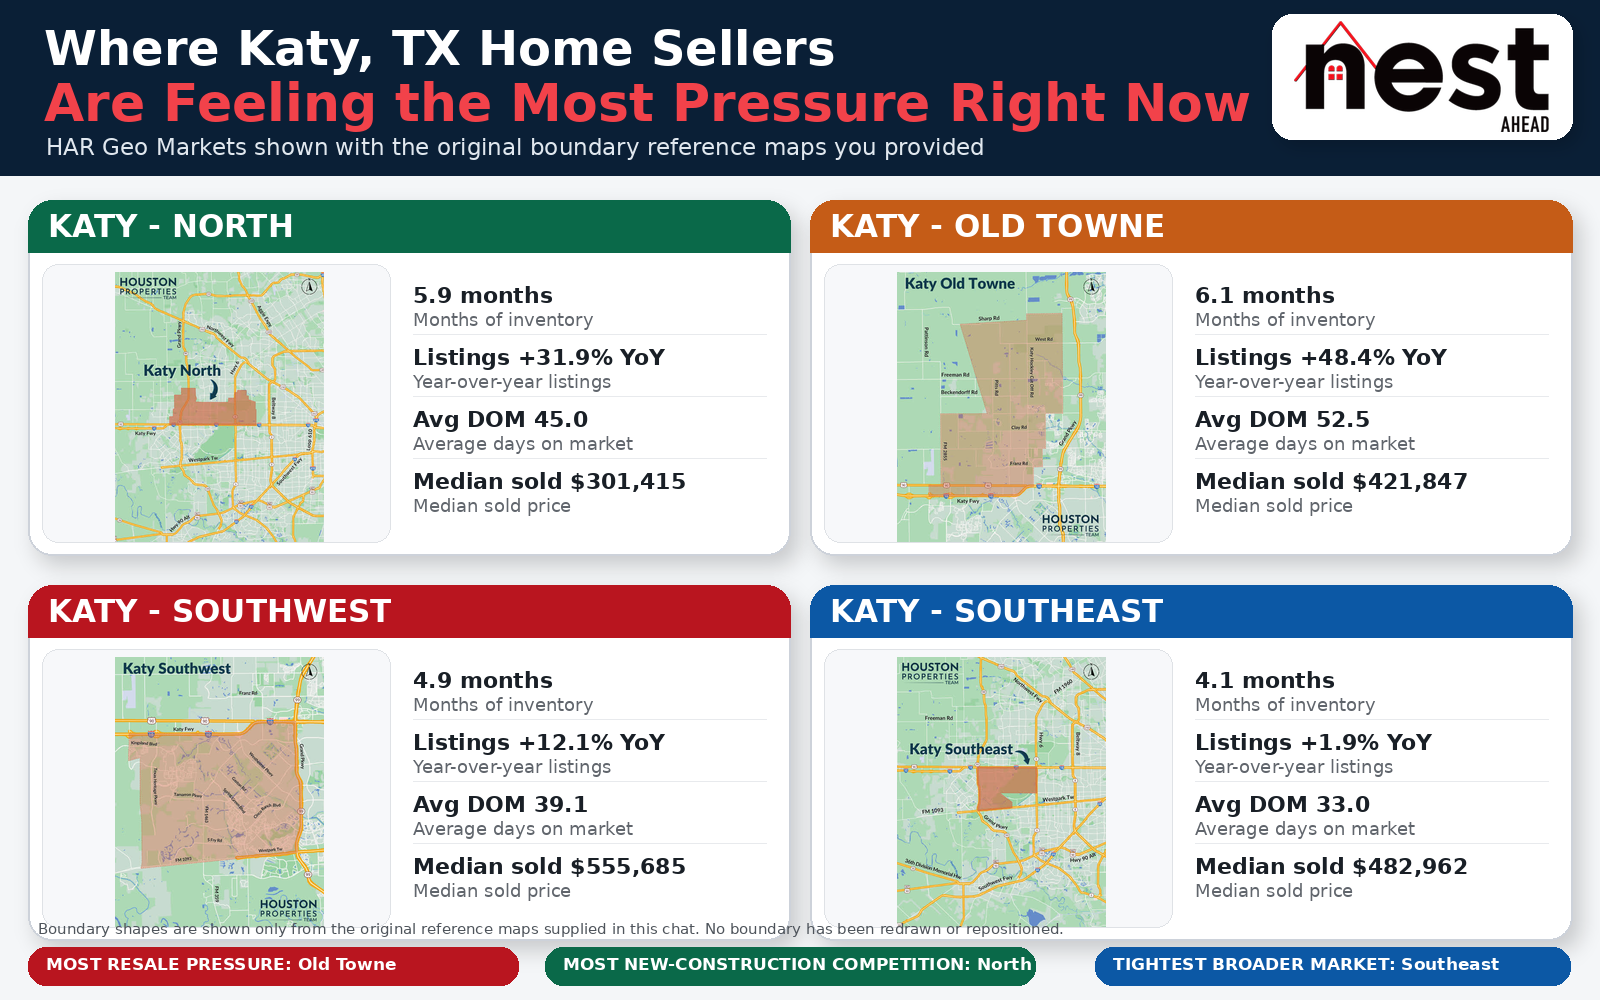
Not every home seller in Katy, TX is competing in the same market.
That becomes especially important when homeowners hear broad statements such as “Katy has more inventory,” “buyers have more leverage,” or “homes are taking longer to sell.”
Those statements may describe the broader direction of the market, but they do not tell us where sellers are actually feeling the most pressure or why.
When I compare the latest HAR data for the Katy market areas, one thing becomes clear:
The type of seller pressure varies considerably depending on where the property is located.
North Katy faces substantial supply and new-construction competition.
Within that broader northern geography, Katy - Old Towne stands out as a more specific, resale-oriented submarket with its own inventory and market-time challenges.
Southwest Katy operates at a considerably higher median price point, while Southeast Katy currently appears comparatively tighter.
That is a much more useful way to look at the market than treating all of Katy as one single set of numbers.
First, a Note About HAR's Katy Market Geography
HAR reports several Geo Markets for the Katy area, including:
- Katy - North
- Katy - Old Towne
- Katy - Southwest
- Katy - Southeast
However, these should not automatically be treated as four completely separate geographic pieces of Katy.
Looking at the HAR boundary maps, Katy - Old Towne sits within the broader northern Katy geography rather than functioning as a completely separate north-south counterpart to Katy - North.
That distinction matters.
For this analysis, I treat Katy - North as the broader northern market and Katy - Old Towne as a more specific historic submarket within that northern area.
Katy - Southwest and Katy - Southeast are separate areas primarily south of I-10.
This prevents us from making the mistake of comparing overlapping geographic areas as though they were four equal, non-overlapping quadrants.
The Broad Katy Market Is Balanced, but the Pressure Is Not Evenly Distributed
HAR currently characterizes these Katy market areas as balanced.
But “balanced” does not mean every seller faces the same conditions.
September 2026 HAR data shows meaningful differences in months of inventory, year-over-year listing growth, average market time and median sold price.
| Market Area | Months of Inventory | Listings vs. Last Year | Average Days on Market | Median Sold Price |
|---|---|---|---|---|
| Katy - North | 5.9 months | Up 31.9% | 45.0 days | $301,415 |
| Katy - Old Towne* | 6.1 months | Up 48.4% | 52.5 days | $421,847 |
| Katy - Southwest | 4.9 months | Up 12.1% | 39.1 days | $555,685 |
| Katy - Southeast | 4.1 months | Up 1.9% | 33.0 days | $482,962 |
*Katy - Old Towne is shown separately because HAR reports it separately, but it should be understood as a more specific historic submarket within the broader northern Katy geography rather than as a completely independent geographic quadrant.
Those numbers help us understand both the broad market and the smaller pockets within it.
View Katy - North market data from HAR.
View Katy - Old Towne market data from HAR.
North Katy Is Facing the Broadest Supply Pressure
Katy - North currently has approximately 5.9 months of inventory.
Listings are up approximately 31.9% from a year ago, and average days on market is about 45 days.
Those numbers already indicate more competition for sellers.
But the most important part of the North Katy story may be what the HAR resale numbers do not fully capture:
the sheer amount of new construction competing for the same buyers.
North Katy contains some of the area's most active residential development corridors, so resale sellers are often competing with both other homeowners and builders.
That creates a different kind of market pressure than simply having more resale listings.
Old Towne Is a Pressure Point Within the Broader North Katy Market
Inside the broader northern Katy geography, HAR's Katy - Old Towne data is especially interesting.
Old Towne currently shows approximately 6.1 months of inventory.
Listings are up approximately 48.4% year over year, and average days on market is about 52.5 days.
Those are the highest figures in this comparison for all three measures.
That tells us something important:
Within North Katy, the established resale market around Old Towne appears to be experiencing particularly strong competitive pressure.
That does not mean every home there is difficult to sell.
It means sellers in that specific market should be especially careful about pricing, condition and how their home compares with the growing number of choices available to buyers.
Old Towne and North Katy Tell Us Different Things
This is where separating the two datasets becomes useful even though the geographies overlap.
Old Towne gives us a more focused look at an established resale-oriented portion of northern Katy.
The broader Katy - North data captures a larger geography that includes significantly more new development.
So the two datasets answer slightly different questions.
Old Towne helps us understand resale pressure within the historic northern market.
Katy - North helps us understand the broader competitive environment, including major new-construction influence.
Used together, they provide more insight than either one would on its own.
New Construction Changes the Competitive Set in North Katy
When a homeowner sells in an area with significant builder activity, buyers may compare that resale property with an entirely new home.
Depending on the builder and community, buyers may encounter:
- New construction
- Builder warranties
- Move-in-ready inventory
- Current floor plans
- Closing-cost incentives
- Financing incentives through affiliated lenders
- Design packages or upgrades
Realtor.com's current new-construction search illustrates the concentration of builder activity in ZIP code 77493.
Its portal currently displays a much larger number of new-construction results in 77493 than in 77494.
Those portal counts should not be interpreted as an exact count of completed, immediately available MLS inventory. They may include plans, proposed homes, inventory homes and other builder offerings.
However, the disparity is useful as a directional indicator of just how concentrated new construction is in northern Katy.
Why Builder Incentives Matter to Resale Sellers
A resale seller may look at another resale home listed nearby and assume that is the primary competition.
The buyer may be looking at something else entirely.
Suppose a resale property and a new-construction home are priced similarly.
If the builder is offering money toward closing costs or a financing incentive through an affiliated lender, the buyer may perceive the new home as offering a better overall financial package.
An individual seller usually cannot duplicate a builder's financing program.
That does not mean the resale property cannot compete.
Established homes may offer advantages such as:
- Larger or more established lots
- Mature landscaping
- Window coverings
- Fencing
- Patio improvements
- Appliances
- Established neighborhood amenities
- Owner-completed upgrades
The key is knowing what the buyer is comparing and making sure the resale property's value proposition is clear.
Katy - Southwest Is Competitive at a Much Higher Price Point
Southwest Katy currently has approximately 4.9 months of inventory.
Listings are up approximately 12.1% year over year, and average days on market is about 39 days.
The median sold price is approximately $555,685, considerably higher than the broader Katy - North median.
That price difference matters because buyers at higher price points may have different expectations regarding:
- Condition
- Updates
- Finish quality
- Lot characteristics
- Floor plan
- Overall presentation
For Southwest Katy sellers, the current pressure appears less about explosive listing growth and more about competing effectively in a market where buyers have enough inventory to be selective.
Katy - Southeast Is Currently Comparatively Tighter
Southeast Katy currently has approximately 4.1 months of inventory.
Listings are up only about 1.9% year over year, substantially less than the increase in the northern market.
Average days on market is approximately 33 days.
Of the broader non-overlapping areas reviewed here, Southeast Katy currently shows the tightest supply picture.
That does not mean sellers can ignore pricing or condition.
HAR still characterizes the market as balanced.
It simply means sellers currently face less supply growth and shorter average market times than we are seeing in the broader northern Katy market.
I-10 Is an Important Geographic Divider
Another important part of understanding these markets is geography.
I-10 runs east-west through Katy and provides a useful dividing line when thinking about the broader market.
Katy - Southwest and Katy - Southeast sit primarily south of I-10.
Katy - North occupies the broader market north of I-10, with Katy - Old Towne representing a more specific historic section within that northern geography.
This matters because housing age, development patterns, price points, builder activity and available inventory vary considerably on different sides of that divide.
There Are Several Different Kinds of Seller Pressure in Katy
The latest data suggests we should stop thinking about seller pressure as one single thing.
1. Established Resale Pressure
Old Towne currently stands out within North Katy for higher inventory, rapid growth in listings and longer market times.
2. New-Construction Pressure
The broader North Katy market faces unusually strong competition from builders and expanding new-home inventory.
3. Higher-Price Buyer Selectivity
Southwest Katy operates at a substantially higher median price point, where buyers may have stronger expectations regarding condition and finishes.
4. Relative Supply Tightness
Southeast Katy currently has less inventory growth and shorter market times than the other broader Katy areas reviewed.
Each of those situations calls for a different seller strategy.
What Should a North Katy Seller Do Differently?
If you are selling in North Katy, I would evaluate more than resale comparables.
I would want to know:
- What resale homes are competing nearby?
- Which builders are currently active?
- What move-in-ready new homes are available?
- What incentives are builders advertising?
- How does the resale home's price compare?
- What advantages does the resale home offer?
- How does the buyer's estimated monthly cost compare between the alternatives?
The correct response is not automatically to lower the price.
The correct response is to understand the buyer's alternatives before choosing the price.
What Should an Old Towne Seller Watch?
Old Towne sellers should pay particular attention to the resale market itself.
With listings rising substantially and average market time longer than in the surrounding Katy areas, I would monitor:
- Current competing listings
- Recent comparable sales
- Days on market
- Price reductions
- Condition differences
- Buyer showing activity
- Final sold prices relative to original asking prices
The more inventory buyers have available, the more damaging an overly aggressive initial price can become.
What Should Southwest Katy Sellers Focus On?
Southwest Katy sellers are dealing with a market where buyers have choices at a considerably higher median price point.
That means condition, updates, presentation and pricing need to work together.
A buyer looking at several homes in the same price range may quickly eliminate one that appears to require substantially more work unless the price reflects that difference.
Current active competition can therefore be just as important as recent closed sales.
What Should Southeast Katy Sellers Take Away?
Southeast Katy currently has the most favorable supply picture of the broader areas reviewed.
That is useful for sellers, but it should not create complacency.
Buyers still have choices.
A home can still sit if its price, condition or presentation does not compare favorably with alternatives.
The difference is simply that the current competitive pressure appears less severe than it does farther north.
Broader Texas Data Supports the Normalization Story
The Texas Real Estate Research Center at Texas A&M University has also documented elevated inventory and more normalized market conditions across Texas.
That broader context helps explain why buyers generally have more time and more choices than they did during the extreme seller's markets of several years ago.
Statewide numbers should not be used to determine the value of an individual Katy property, but they are useful context for understanding the larger market cycle.
Explore Texas housing data from the Texas Real Estate Research Center.
What the Public Data Cannot Tell Us
There are limits to public market summaries.
For example, I have not found a reliable public dataset showing the exact percentage of listings receiving price reductions separately across all of these Katy market areas.
So I would not assign a precise price-cut rate to one area without a reliable source.
The conclusions in this analysis are instead based on documented indicators such as:
- Months of inventory
- Year-over-year listing growth
- Average market time
- Median sold price
- New-construction concentration
Those indicators provide meaningful insight without claiming precision the available data cannot support.
My Read on the Katy Market Right Now
If I had to summarize the current Katy seller environment, I would put it this way:
North Katy is facing the broadest supply and new-construction pressure.
Within North Katy, Old Towne currently stands out as a particularly pressured established-resale submarket.
Southwest Katy remains competitive at a higher price point where buyer expectations can be more demanding.
Southeast Katy currently appears comparatively tighter, with lower inventory growth and shorter market times.
That is much more useful than simply saying, “Katy is a balanced market.”
The market may be broadly balanced, but the pressures sellers face are not evenly distributed.
What Does This Mean for Your Katy, TX Home?
If you are thinking about selling, I would not base your strategy on one broad Katy statistic.
I would want to know which market your property actually competes in.
That means looking at your subdivision, price range, recent comparable sales, current active competition, pending activity when available, property condition and nearby new construction.
If you would like to see how your home compares with today's market, you can start with Nest Ahead's home evaluation page:
Request a Katy, TX Home Evaluation
You do not have to be ready to sell immediately.
Understanding what your home is actually competing against can help you make better decisions about pricing, preparation, timing and whether now is the right time to move.
Sources and Methodology
This analysis uses September 2026 market data from the Houston Association of REALTORS®.
Katy - Old Towne is discussed as a more specific submarket within the broader northern Katy geography based on the HAR Geo Market boundary maps rather than treated as a separate non-overlapping quadrant.
Realtor.com new-construction search results are used only as a directional illustration of builder activity and should not be interpreted as an MLS-equivalent count of completed, immediately available homes.
Texas Real Estate Research Center data is used as broader statewide context.
Jonathan McNabb, REALTOR®
Broker/Owner, Nest Ahead
Katy, TX and Greater Houston
281-549-8099
Jonathan.NestAhead.com
Local Roots | Global Reach
This article is provided for general real estate information. Market conditions vary by property, neighborhood, price range and reporting period. Market statistics are not an appraisal or guarantee of a property's value or future performance. Builder inventory and incentives can change frequently and should be independently verified when evaluating a specific purchase or sale.

Jonathan McNabb
Broker/Owner | Nest Ahead
or another way